Blog


At Gaviti we are always looking for ways to improve our platform and provide our users with the tools they need to manage their accounts and optimize their collections efforts. That’s why we are excited to announce the addition of several new metrics to the collections dashboard. For a review of all our new features please read this post. In this post we will go in depth into all the additions to our A/R collections dashboard
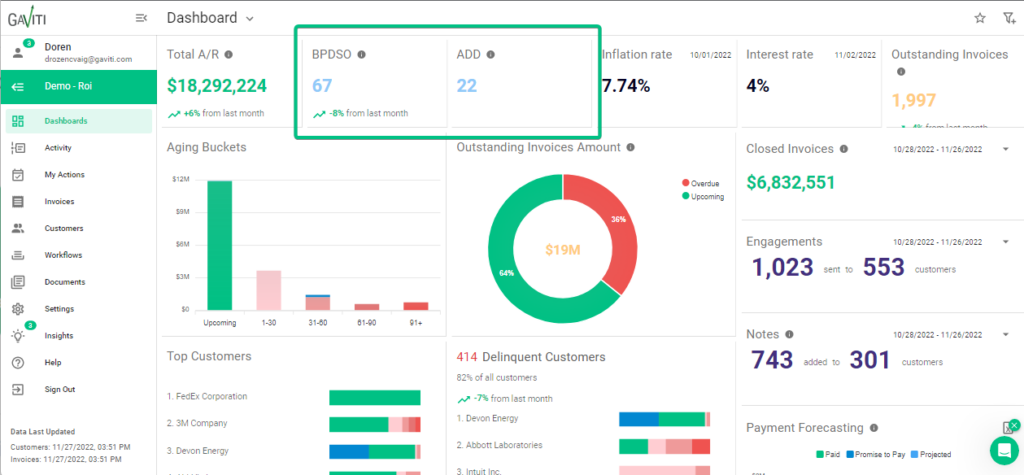
First up is the BPDSO (Best Possible Days Sales Outstanding) metric. This KPI is calculated by dividing the current accounts receivable by billed revenue and multiplying that number by the number of days in the billing period.
The BPDSO helps users understand the potential performance of their collections team and identify areas for improvement. By tracking this metric over time, users can see how their team’s performance compares to their own potential and make decisions about how to optimize their collections efforts.
To calculate the BPDSO, simply divide the current accounts receivable by the billed revenue and multiply that number by the number of days. For example, if a company has $50,000 in current accounts receivable and $100,000 in billed revenue, their BPDSO would be (50000 / 100000) x 365 days = 183 days.
We believe the BPDSO will be a valuable addition to the Gaviti dashboard and will help our users optimize their collections efforts. By understanding the potential performance of their team, they can make informed decisions about how to improve their collections process and improve their desired results.
Next, we have the ADD (Average Days Delinquent) metric. This KPI measures the number of days that a payment is overdue, calculated by subtracting the BPDSO (Best Possible Days Sales Outstanding) from the DSO (Days Sales Outstanding).
The ADD helps users understand the actual performance of their collections team and identify any delays in the collections process. By tracking this metric over time, users can see how their team’s performance compares to their potential and make decisions about how to optimize their collections efforts.
To calculate the ADD, simply subtract the BPDSO from the DSO. For example, if a company has a DSO of 200 days and a BPDSO of 183 days, their ADD would be 200 days – 183 days = 17 days.
The ADD (Average Days Delinquent) metric is a valuable addition to the Gaviti dashboard that will help users optimize their collections efforts. By understanding the actual performance of their team and identifying any delays in the collections process, users can make informed decisions about how to improve their collections process and achieve their desired results.
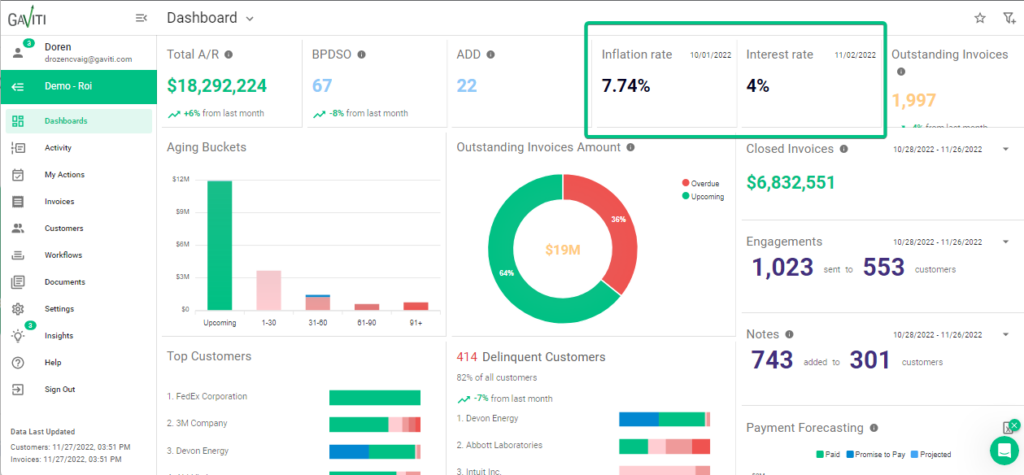
We are also adding the inflation rate and interest rate to the dashboard.
These metrics, which are pulled from an API (available only for the USA), provide users with valuable insights into the economic factors that may be impacting their accounts.
Understanding the inflation rate can help users make informed decisions about their pricing and how it may be impacted by changes in the economy. It can also help them understand the purchasing power of their customers and make adjustments to their collections strategies accordingly.
The interest rate, on the other hand, can help users understand the cost of borrowing money and make decisions about how to finance their operations. It can also impact the amount of money customers are able to pay on their accounts, and understanding this metric can help users make informed decisions about their collections efforts.
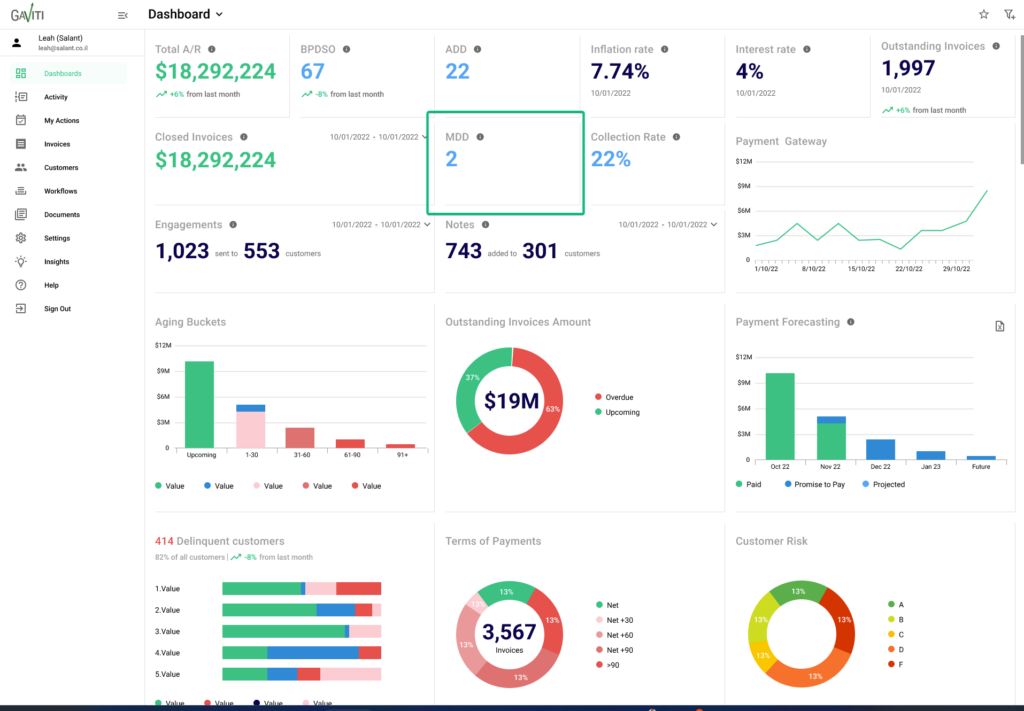
Another new metric we are introducing is the MDD (Median Days Delinquent). This KPI measures the number of days between the due date and the actual payment date for all late payments and calculates the median number of days.
The MDD was developed by our team and is based on actual customer data. It provides users with a deeper understanding of their accounts’ payment patterns and can help them identify any trends or issues that may be impacting their collections efforts.
To calculate the MDD, we first gather data on all late payments and determine the number of days between the due date and the actual payment date. We then calculate the median number of days, which is the middle value in a set of data. This provides a more accurate representation of the payment patterns for a company’s accounts and can help users make informed decisions about how to optimize their collections efforts.
We are constantly working to improve the Gaviti A/R collections dashboard and are excited to announce several upcoming features that we believe will be valuable additions to the platform.
Overall, we believe these upcoming features will be valuable additions to the Gaviti A/R collections dashboard and will help our users optimize their collections efforts. We look forward to bringing these features to our users soon.
As an existing Gaviti user, you can contact your customer success manager for more information on these new and upcoming features, as well as assistance in accessing them. If you are not yet a Gaviti customer, we would be happy to show you how our platform can help streamline your invoice-to-cash flow process. Please don’t hesitate to reach out to us for more information.


Link is copied!
Contact us!
Welcome back