Blog


Allowance for doubtful accounts (ADA) is a financial metric that estimates the value of rendered services or goods sold that you don’t expect to get paid for. Essentially, it’s a tool used in accrual accounting as a way of tracking bad debt and potentially uncollectible accounts up front with the end goal of maintaining more accurate financial statements.
But what is the allowance for doubtful accounts in application and how do companies calculate it?
Tracking ADA helps you maintain more accurate balance sheets. ADA is a type of contra asset account used to reduce your account receivable balance (“contra asset” referring to an asset account where the account balance is a credit balance). ADA is paired with bad debt expenses on your company’s balance sheet, meaning that when you fail to collect on an invoice, ADA is credited and bad debt expense is debited.
This is important due to one common and unfortunate business reality: When businesses extend credit to a company, they risk the potential of bad debt. In other words, companies don’t always pay what they owe. When a company fails to pay some or all of its debt, that sum should be accounted for in the balance sheet to create the most accurate snapshot possible of accounts receivable (A/R) and financial health overall.
The allowance for doubtful accounts helps CFOs and controllers better understand the true state of a company’s finances and make more accurate cash flow projects long-term via balance sheet forecasting. It can also be thought of as a risk assessment tool that gives finance teams a better idea of how future clients may perform with respect to paying their debts. In addition, tracking doubtful accounts is a requirement of financial regulations that accounting departments must adhere to such as the Generally Accepted Accounting Principles (GAAP) and International Financial Reporting Standards (IFRS).
There are three primary ways for how to calculate bad debt expense or estimate doubtful accounts.
The first method involves examining credit sales (or the percentage of total collected A/R) and using historical collection data to determine how much of your invoices are written off, on average.
For example, if your company assesses A/R with a total value of $10,000,000 and your historical default rate is 2%, you can assume that $200,000 of your total will fall under doubtful accounts receivable. This method is simple and works best for companies with straightforward billing cycles that operate primarily on credit.
The second method uses A/R aging reports to assign expected default rates to accounts receivable aging categories. The longer a given account remains in delinquency, the more likely it is that it’ll fall into doubtful accounts receivable.
Here’s an example of how this might look:
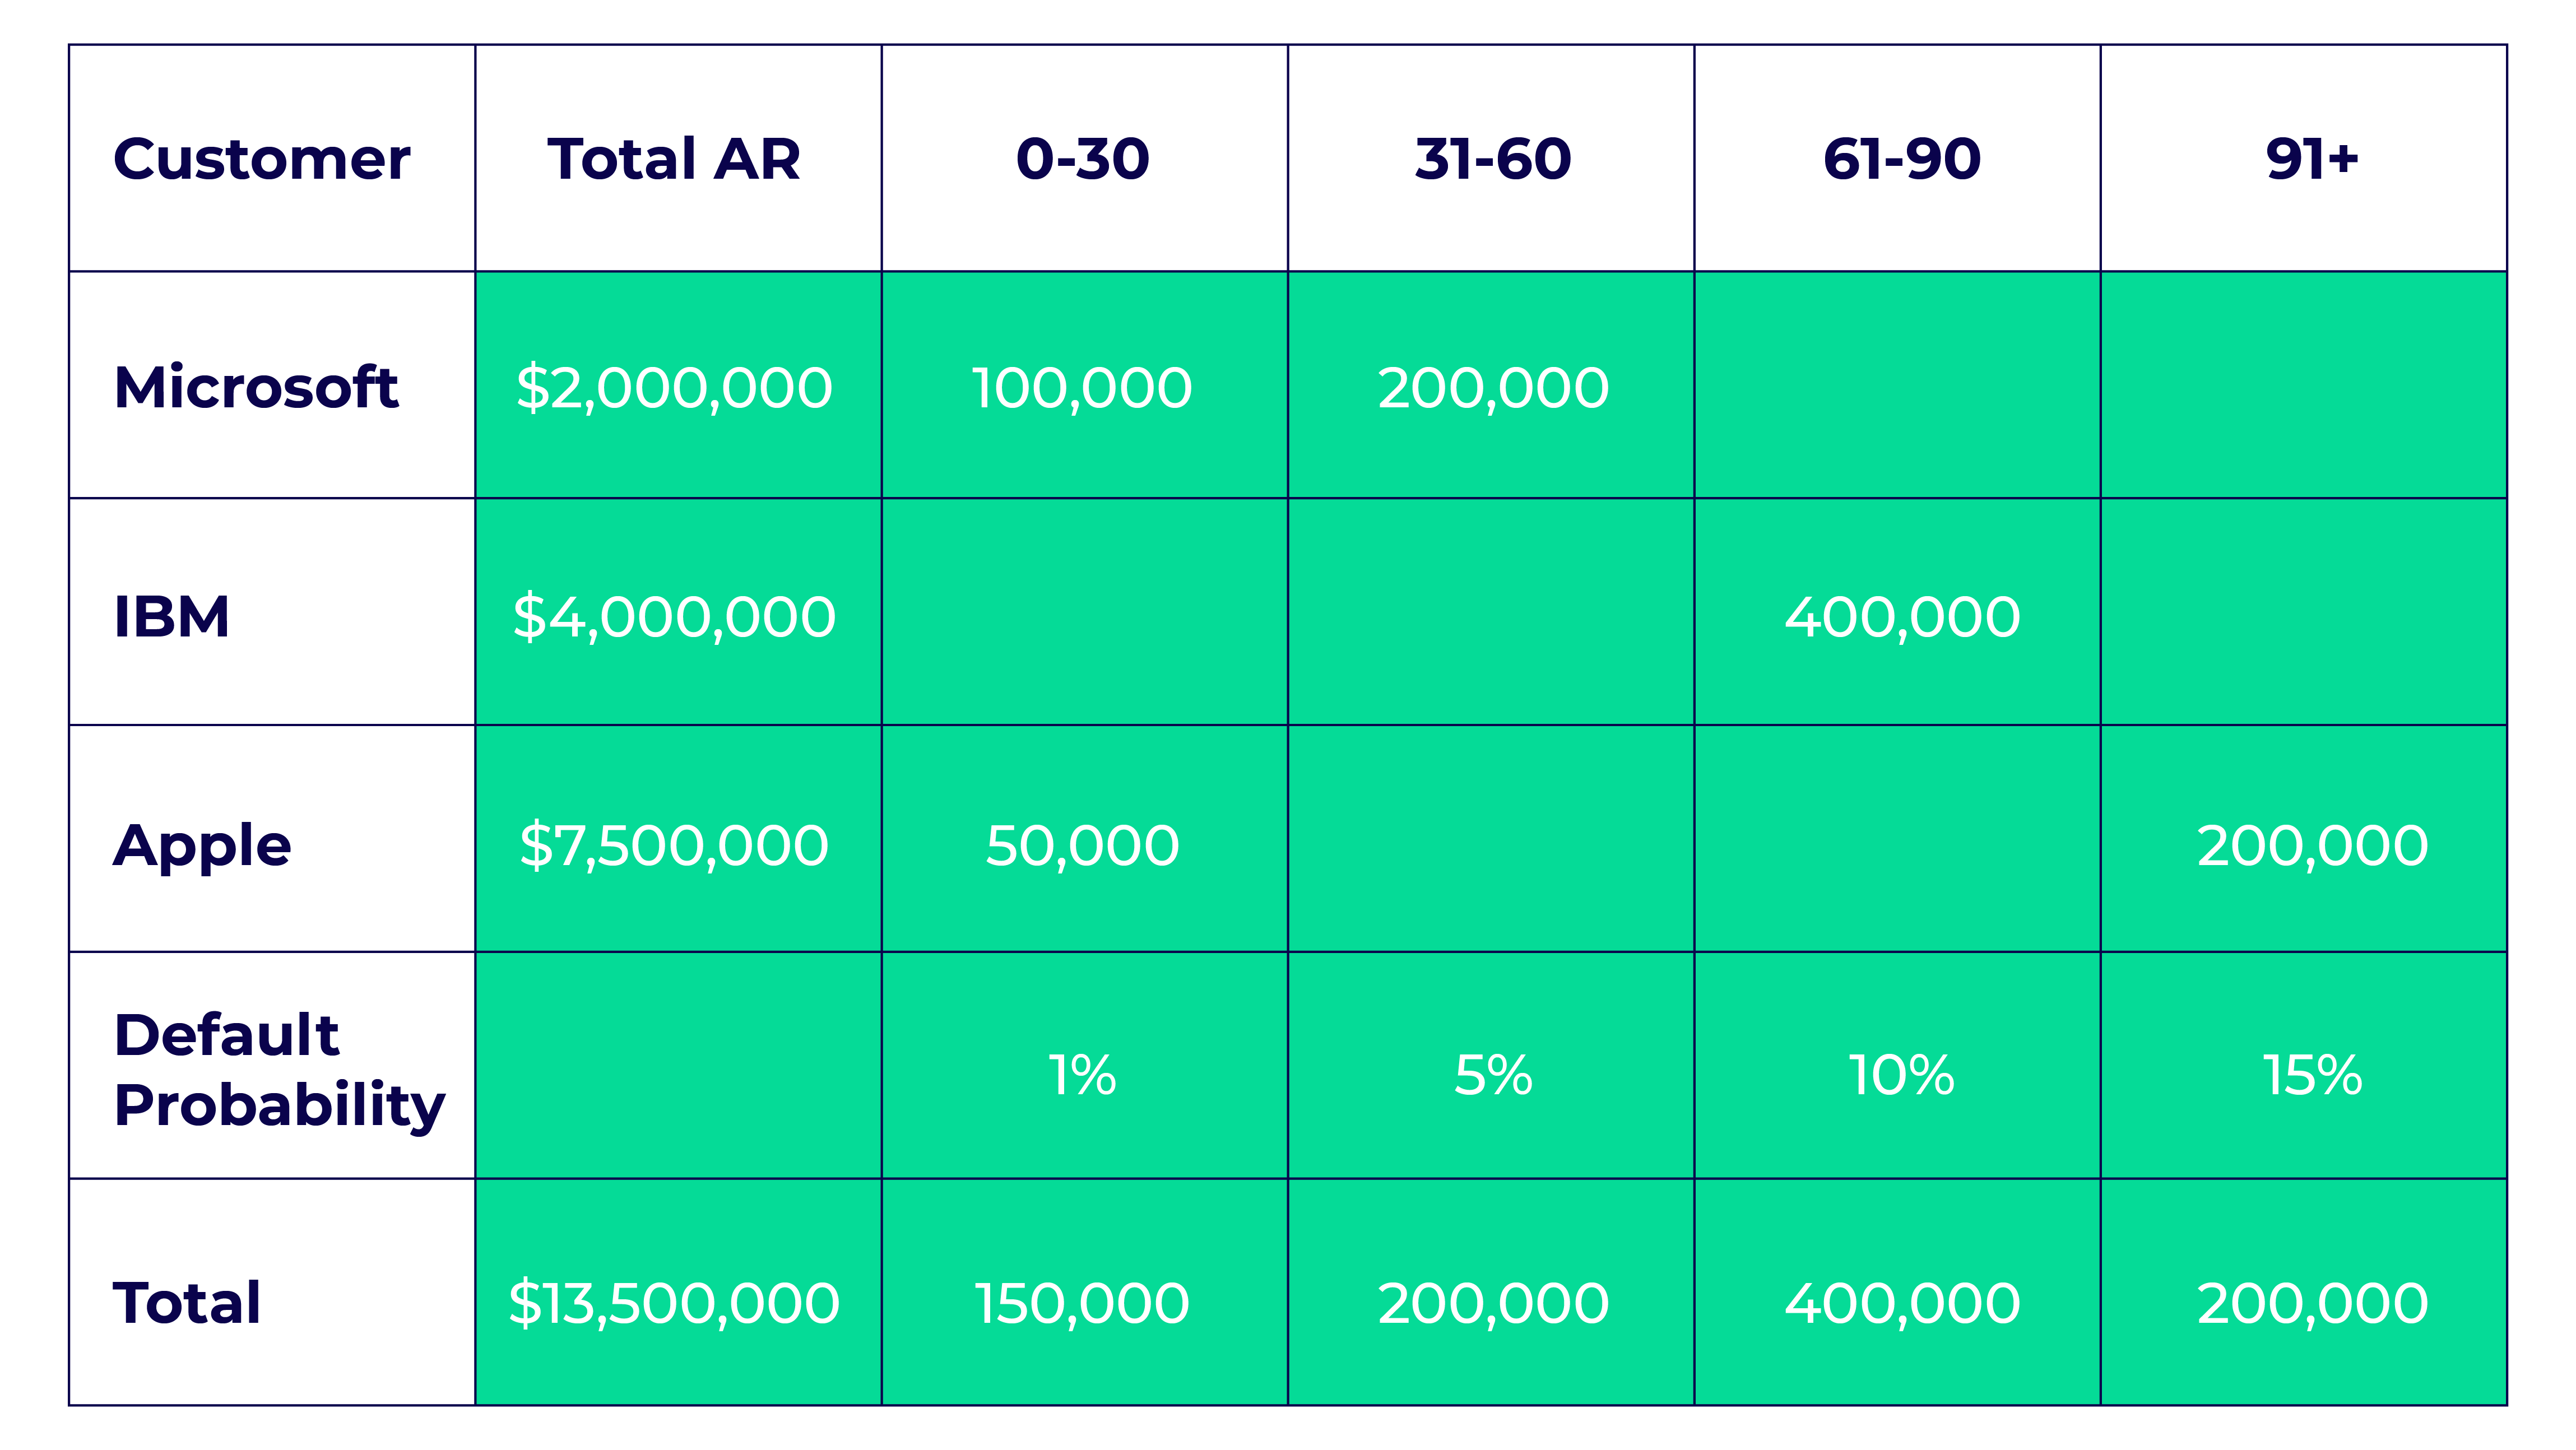
With this data, your ADA calculation would be this:
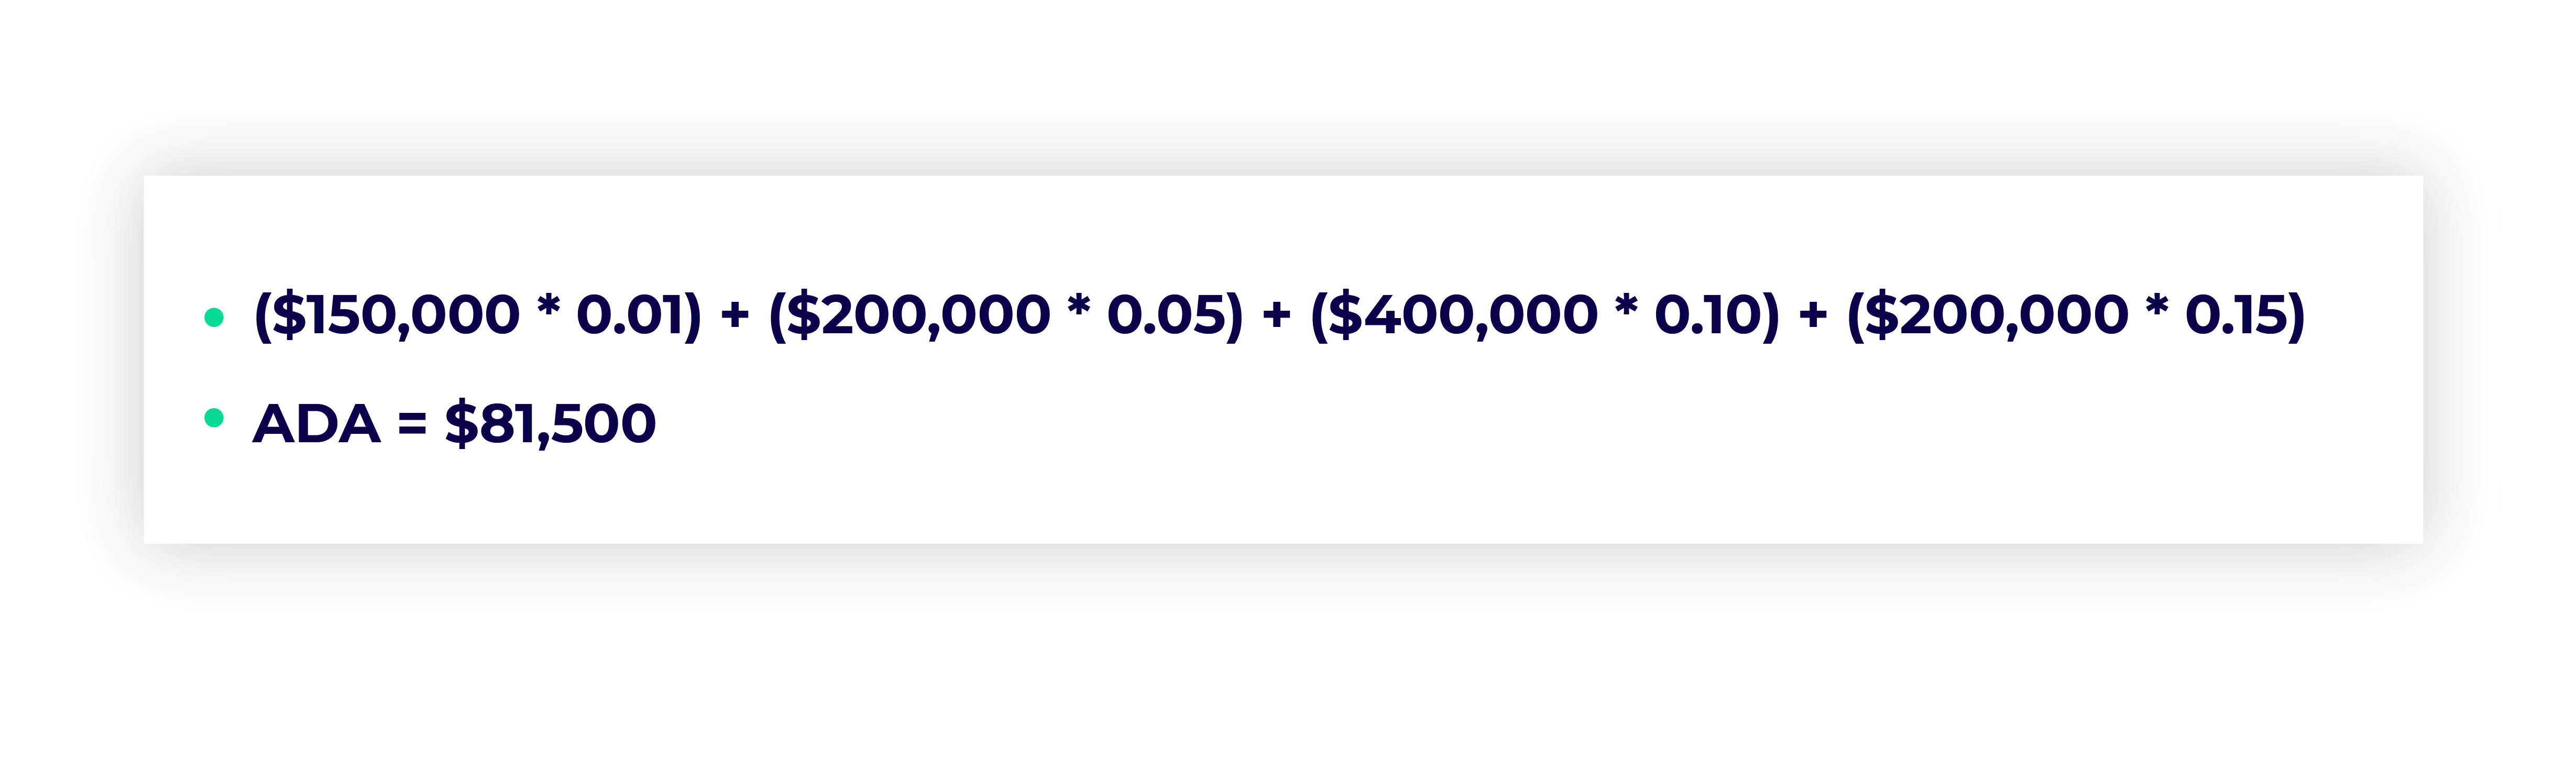
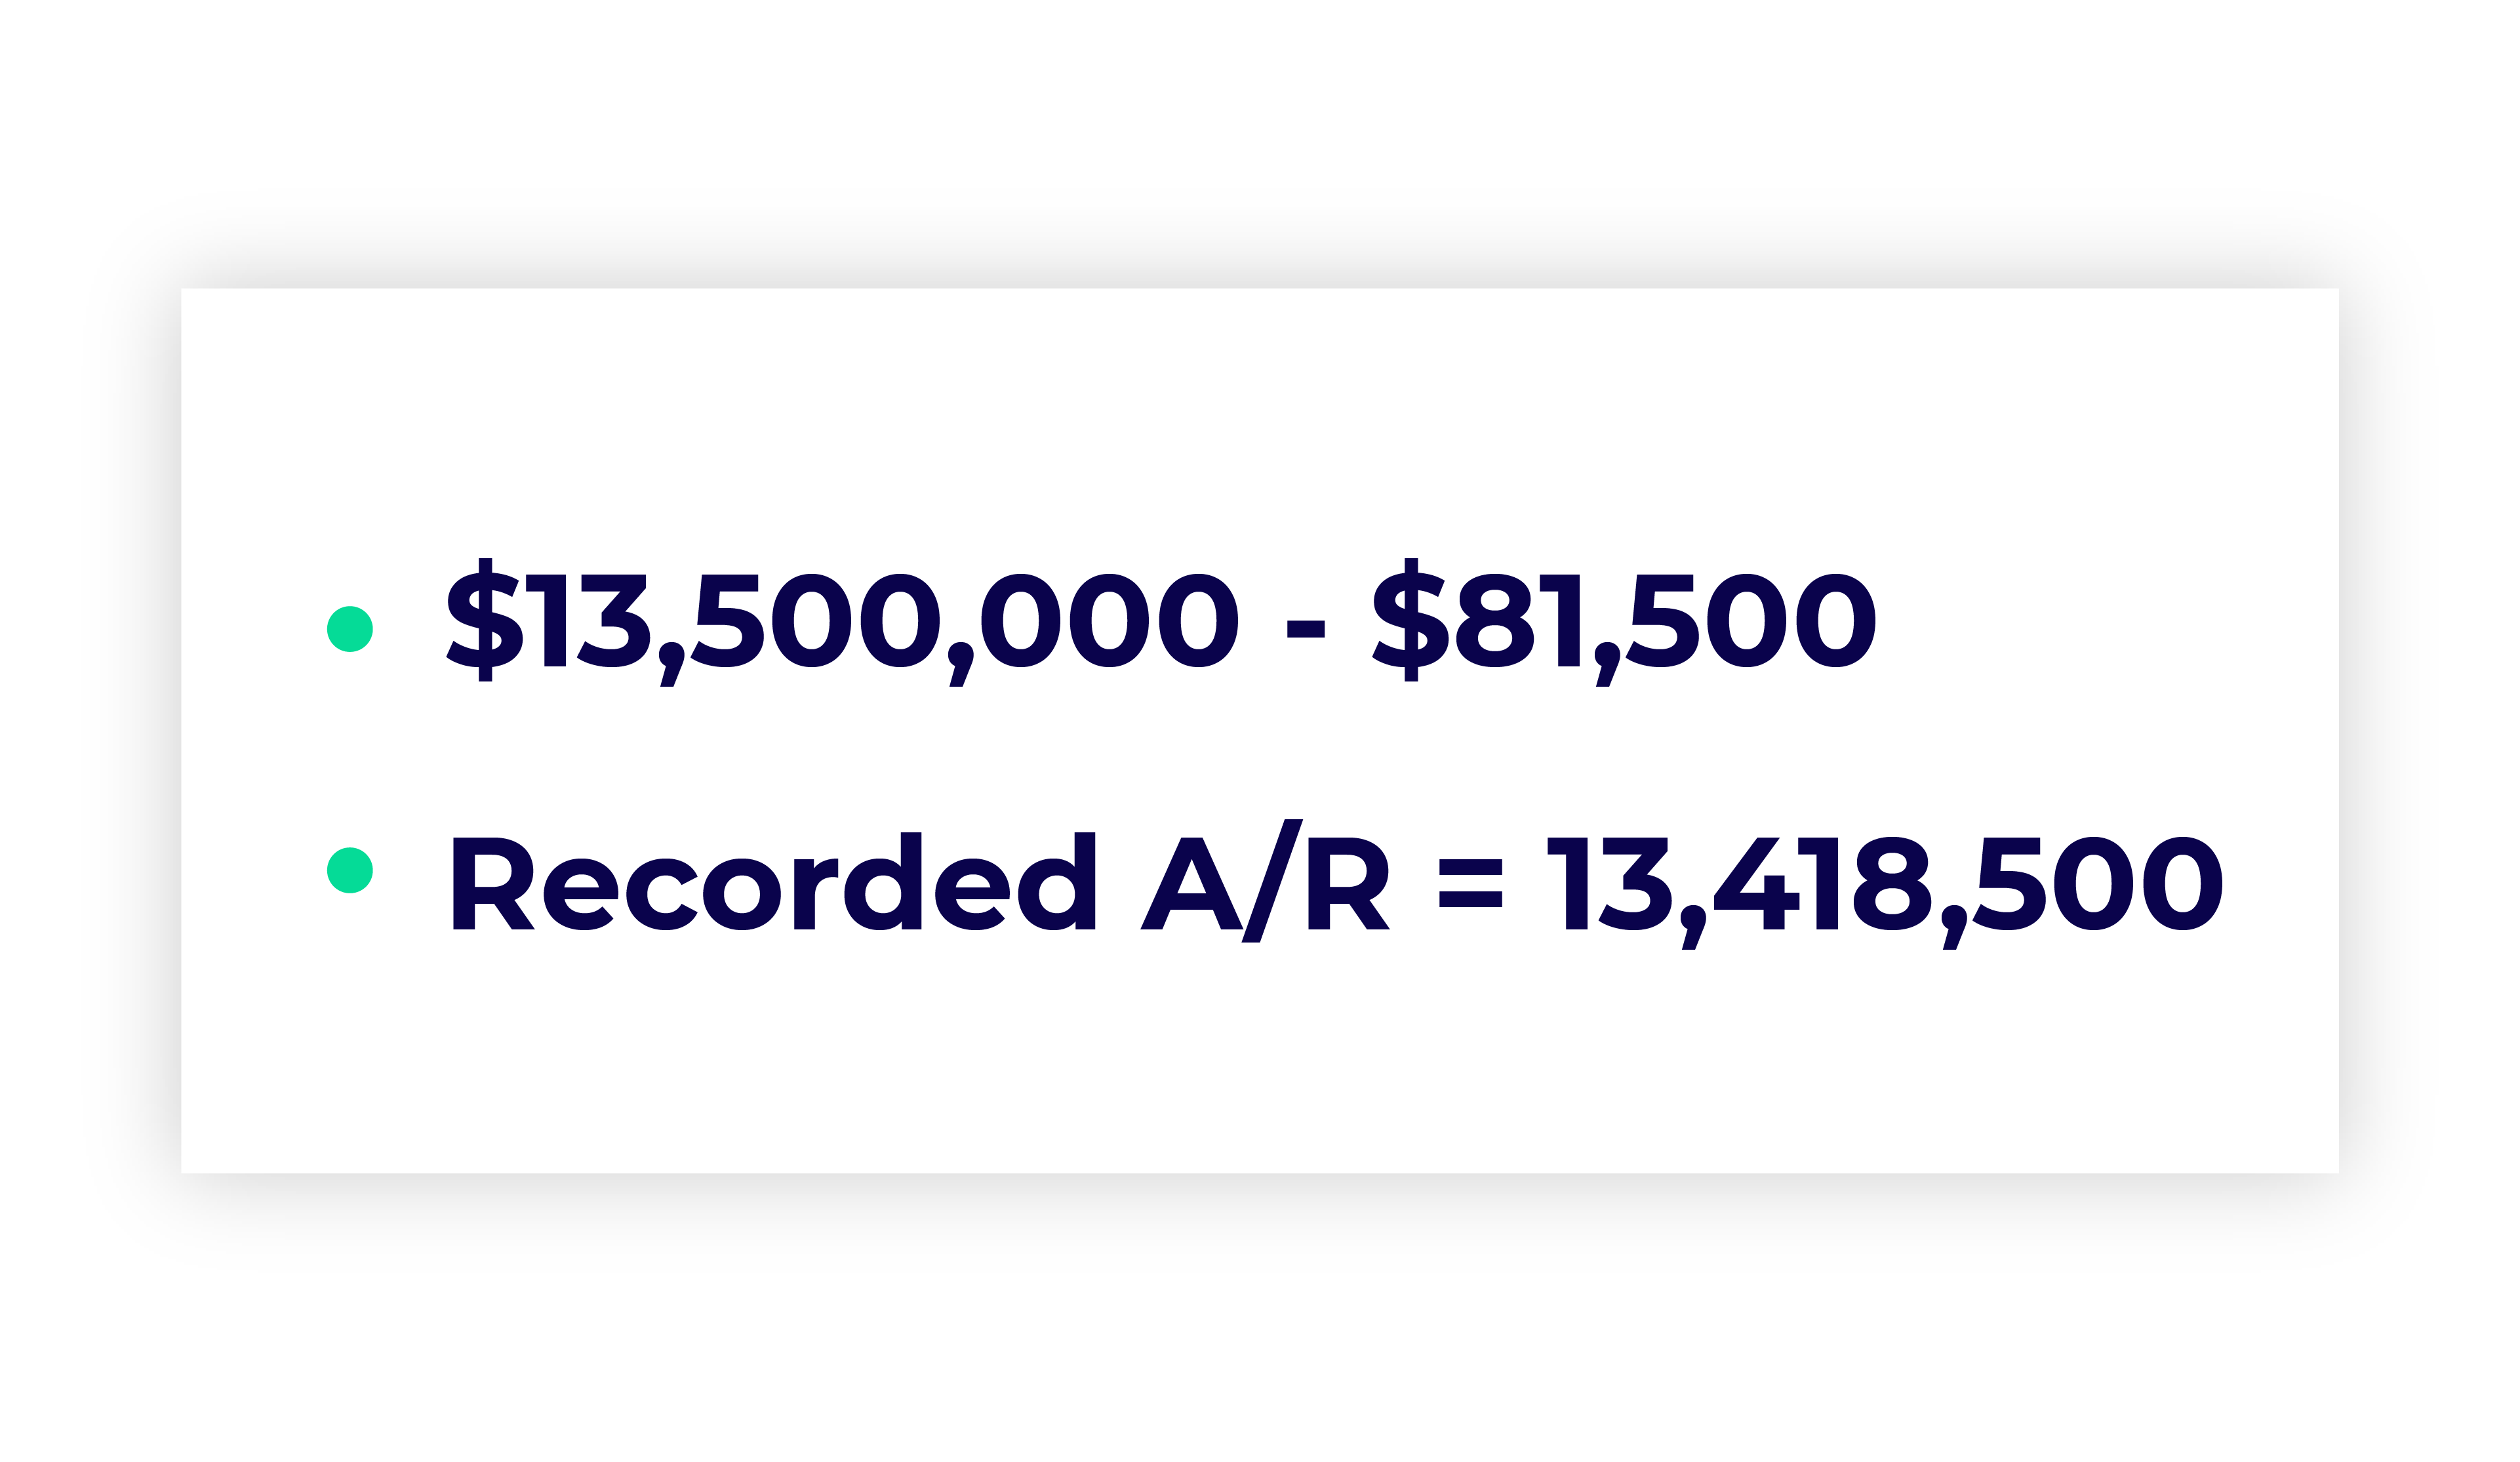
Then, subtract your ADA from your total A/R:
The third method takes the most granular approach yet by assigning personalized default risk percentages or risk scores to each customer based on historical trends. This method is commonly used when client relationships span years and provide plenty of historical data for your business to pull from. If you want to assign a risk classification to a new customer you can calculate this based on the customer’s credit score, credit report from a credit bureau, and using historical payment and credit data from similar companies. The risk classification becomes more accurate based on the customer’s payment history.
Given that the default probability is unique to each company, this method offers the most accurate way of predicting ADA. The only way to do this accurately and at scale is with a software that uses AI and the appropriate algorithms to collect and analyze this data.
It’s important to understand that selecting the right allowance for doubtful accounts formula directly impacts financial accuracy.
There are three commonly used approaches:
This method estimates bad debt based on a fixed percentage of total credit sales. It’s simple and works well for businesses with stable historical trends. But, it may overlook changes in customer behavior or economic conditions.
This approach segments receivables into aging buckets (e.g., 0–30, 31–60, 61–90 days) and assigns a higher risk percentage to older balances. It provides a more precise estimate and aligns closely with real collection risk. This is where tools like an accounts receivable aging report become essential.
This method evaluates individual accounts based on risk. While highly accurate, it’s time-consuming and often impractical without automation.
For most finance teams a hybrid of aging analysis and risk scoring delivers the best results, especially when supported by data from a full accounts receivable analysis
To properly reflect expected losses, companies must record an allowance for doubtful accounts entry. This ensures revenue is not overstated and aligns with accrual accounting principles.
The standard journal entry includes:
This entry increases expenses while creating a contra-asset account that reduces accounts receivable on the balance sheet.
When a specific account is deemed uncollectible, the write-off entry is:
This process does not impact the income statement at the time of write-off because the expense was already recognized earlier.
Maintaining accurate entries is critical for financial transparency and aligns closely with the concept of a bad debt reserve, which serves as a financial buffer against credit losses.
Maintaining an accurate ADA is not a one-time exercise, it’s an ongoing challenge that grows as your customer base expands and market conditions shift.
Many companies still rely on annual or quarterly reviews, but this approach creates blind spots. Payment behavior can change quickly, and waiting months to adjust your estimates can result in overstated revenue or unexpected write-offs.
A more reliable approach is continuous monitoring.
Annual reviews fail to capture:
By the time adjustments are made, the financial impact may already be significant.
Tracking aging buckets in real time allows finance teams to detect trends early. For example:
Combining this with customer risk scoring, based on payment history, credit data, and behavior, provides a more accurate picture of collectability.
Modern A/R automation platforms take this a step further by:
Instead of relying on static assumptions, finance teams can align their ADA with real-world performance.
This shift not only improves financial reporting accuracy but also supports proactive collections strategies, reducing the overall level of bad debt.
The concept of allowance for bad debts has become more dynamic as customer payment behavior evolves. Economic shifts, industry disruptions, and extended payment terms all affect collectability.
Static assumptions, like applying the same percentage year over year, can quickly lead to underestimating risk. Finance leaders now need to incorporate:
This shift is why many organizations are moving away from manual estimation toward data-driven forecasting models.

Gaviti’s accounts receivable automation solution streamlines your A/R processes and helps your team work better. Make better credit decisions, lower DSO, and reconcile payments with near perfection. Schedule a demo to learn more.
Schedule a Product DemoWhile no company expects to see substantial amounts of value lost through bad debt, it’s an important metric to stay on top of. Fortunately, ADA is relatively straightforward to track with the above methods. No particular method is truly better than another; what works for one business may be unsuitable for another.
But by streamlining and automating the A/R process with Gaviti’s autonomous invoice to cash accounts receivable platform, you can proactively guard against these doubtful accounts — which could become uncollectible accounts — in the first place.
Gaviti’s modules include:
Want to get started streamlining and automating your accounts receivable with Gaviti’s autonomous invoice to cash accounts receivable platform? Get a demo today!
Allowance for doubtful accounts is a balance sheet account that estimates uncollectible receivables, while bad debt expense is recorded on the income statement to reflect expected losses during a specific period. The expense feeds into the allowance to ensure accurate financial reporting.
The aging of accounts receivable method is generally the most accurate because it reflects the likelihood of collection based on how long invoices remain unpaid. Combining it with customer risk scoring further improves precision, especially in complex B2B environments.
Yes, both GAAP and IFRS require companies to estimate and report expected credit losses. This ensures that accounts receivable are not overstated and financial statements provide a realistic view of collectible revenue.
Best practice in 2026 is continuous review rather than periodic updates. At a minimum, companies should reassess ADA monthly, but organizations with higher transaction volumes benefit from real-time monitoring and automated adjustments.A/R automation can help with this.
Automation improves ADA estimation by analyzing real-time payment data, updating risk scores dynamically, and identifying early signs of delinquency. This allows finance teams to make more accurate forecasts and reduce reliance on outdated assumptions.


Link is copied!
Contact us!
Welcome back